These modules were produced by the AY 201b students of the Spring 2013 term.
For a full description of the module creation process, motivations, and outcomes, see our article arXiv:1308.1908.
For a summary of all the modules created in 2013, download the handout from our May 21st event.
![]()
The Multiphase ISM (Kate Alexander) 

This World Wide Telescope tour transports viewers through the Milky Way on a variety of scales, highlighting the different components of the ISM in our galaxy. The tour audio track provides a basic overview suitable for the general public while clickable hyperlinks send viewers to a companion website, which provides additional information. The website includes introductory material about the ISM and basic physical concepts, along with more detailed information about specific tour stops and higher-level discussion of several physical processes important in the ISM. Images used in the tour include data from the H-alpha all sky survey, the SFD dust map, Spitzer data, Hubble images, and Chandra X-ray data.
2d Shock Visualizations (Fernando Becerra) 

A 2D representation of shocks in the ISM based on fixed grids simulations. The interface allows the user to choose between two options: running a new simulation or loading snapshots of a previously run simulation. The implemented GUI can display different properties of the grids representing the fluid such as density, pressure, energy and velocity. When running a new simulations the user can also modify the initial conditions to explore how these changes affect the behavior of shocks.
Visualizing the Milky Way Project (Hope Chen) 
The module will present the two bubble catalogues released by the Milky Way Project (Simpson et al. 2012), using World Wide Telescope. Different aspects of these bubbles, such as the size, will be included in this presentation as markers of different sizes and colors in WWT. The catalogue from Green Bank Telescope HII Region Discovery Survey (Wenger et al. 2013) will be overplotted to show correspondence/offsets between these two datasets, namely, between shell-like structures identified by eyes and physically meaningful HII regions. A WWT tour and possibly a simple set of java/d3 presentations of statistical properties will be made as well.
3D Cassiopeia (Pierre Christian) 
A three dimensional representation of the DeLaney 2010 Cas A data. The module will allow users to zoom through this representation and observe interesting features in three dimensions (e.g. shocks & jets). The module will also allow users to turn on and off different elements. I will include a website explaining the methods used in producing DeLaney’s three dimensional ‘image’, as well as the scientific insights that we can learn from this technology. In addition, I will also create a video tour of the visualization.
Visualizing Turbulence in the ISM (Doug Ferrer) ,C++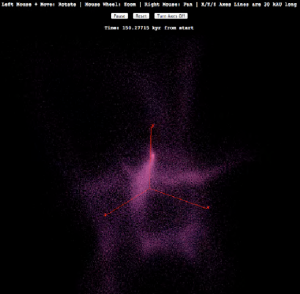
Shocks in the ISM–From Simulations to Observations: This module plays with making mock observations of SPH ism simulations using a simple radiative transfer code. Users can look at different emission lines and angles of observation, and compare this with a rendering of the full three dimensional structure. Several different realizations with different starting parameters will be provided, illustrating how observations can refine our understanding of ISM simulations and visa-versa.
Visualization of the Radio Sky (Kirit Karkare) 
This module will visualize the dominant Galactic foreground components of the microwave sky (synchrotron, free-free, thermal dust) using Javascript and d3. Using all-sky surveys at frequencies ranging from long-wavelength radio to the far IR, the user will be able to see how the galaxy’s brightness changes as different astrophysical sources dominate. There will be a feature allowing the user to view the SED of any given patch on the sky, and potentially a power spectrum at selected frequencies.
3D Datacube Visualizer (Walker Lu) 
Visualization of molecular outflows around protostars, e.g. L1551, with Mayavi2 package: The module will present the archival data in the position-position-velocity space, to intuitively show the outflows in star forming regions. The goal is to provide an alternative and more efficient way to present the kinematics and/or fragmentation other than channel maps and velocity field usually found in star formation papers. Also considered is to incorporate 2-d infrared or dust continuum images (tiled on the surface of the 3-d cube) in the demonstration.
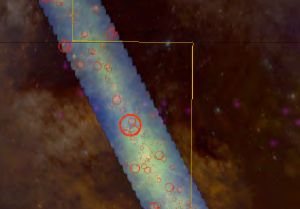
Landmarks of the ISM (Meredith MacGregor) 
‘Landmarks of the ISM’ is a World Wide Telescope tour that introduces viewers to a variety of beautiful objects in the interstellar medium. Images at multiple wavelengths are used to explain some of the physics behind each object’s appearance and why observing at different wavelengths gives a unique view of each region. An audio track provides narration accessible by the general public. In addition, hyperlinks are added throughout the tour. Clicking on these links takes viewers to an external WordPress site that provides additional information at a higher level for anyone looking to learn more about a specific topic mentioned.
Clumpiness in Molecular Clouds (George Miller) 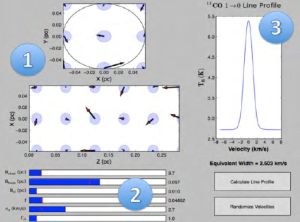
This module explores the effects of clumpiness within giant molecular clouds on their observed line profiles. I have developed an interactive python code which allows the user to vary the cloud’s radius, projected beam radius, clump radius, clump volume filling factor, clump velocity distribution, and relative clump density. These changes are seen in both model cross sections of the cloud and a 13CO 1-0 brightness temperature line profile. An equivalent width is also calculated in order to quantitatively explore the very different degrees of effect these parameters have on the cloud’s line profile, particularly noticeable in the damped dopler wings.
Magnetohydrodynamic Shocks (Philip Mocz) 

MHD Shocks: This Mathematica module seamlessly animates the evolution of fluid variables (density, pressure, velocity) and the magnetic fields for the 1D MHD Riemann problem. The user can use sliders to initialize a discontinuity in the fluid and learn about how shocks evolve. The module highlights the different MHD wave speeds and rotation of the magnetic fields due to the shock. The user may also study the simpler Euler shock problem (no B fields) in a separate module to gain more intuition about shocks.
Meet the Eagle Nebula (Stephen Portillo) 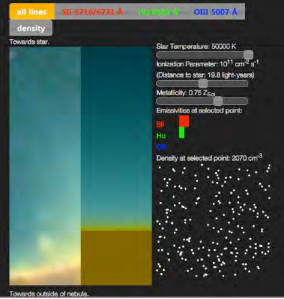
The famous Pillars of Creation image showed the existence of photoevaporative flows at the photoionization boundaries of HII regions. This module demonstrates how the physical properties at the photoionization boundary can be determined from Hubble Space Telescope images. The user is allowed to manipulate the incoming radiation temperature and strength as well as the metallicity of the gas, and then can see the resulting density gradient and a mock-up of how the photoionization boundary looks in the HST bands used for the Pillars of Creation image.
All About Bonnor-Ebert Spheres (Zack Slepian) 
This Mathematica module dramatizes collapse of an isothermal gaseous sphere embedded in a pressurized medium. Sliders control sound speed and initial conditions, with qualitative explanation of how collapse time, speed, and final mass depend on these quantities. Spherically symmetric magnetic fields are treated as producing an increased effective pressure. Hence the module will show that, in this idealized scenario, there is a degeneracy between non-zero magnetic field and increased sound speed. Qualitative discussion of the role of magnetic fields in star formation will add nuance to this simplified visual treatment.
Interstellar Absorption and the Lyman Alpha Forest (Yuan-Sen Ting) 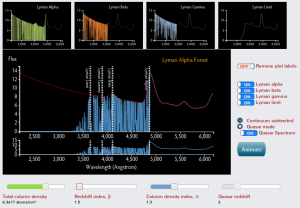
-
Spectral line formation: Users can choose various elements and absorption lines from a dropdown menu. After choosing an absorption line, users can change the column density, the Doppler width and the redshift of the absorbing gas cloud using the slider bars. The module will update the spectral profile correspondingly, as well as tracing the curve of growth in a separate plot.
-
Lyman alpha forest: This interactive module allows users to change the total column density, the distribution of the absorbing gas clouds (the redshift and column density power law indices) as well as the quasar redshift. On top of that, users can choose to turn on and off the absorption from Lyman alpha, beta, gamma electronic transitions and Lyman limit absorption continuum, separately. After choosing these parameters, users can choose to play a animation. This animation will show how Lyman alpha forest is formed: the quasar spectrum is redshifted continuously as the Universe expands. Eventually, the quasar spectrum gets absorption lines from different absorbing clouds encountered at different times.
Nearby Nebulae: Explore the sky to see different HII regions (Anjali Tripathi) 
This module will provide an interactive introduction to the qualitative properties of HII regions, using Mathematica. Users will be able to vary the surrounding environmental conditions to see their effects on the resulting size, shape, and evolution of idealized HII regions. Comparison to specific observable HII regions will be included, to show the applicability of the simplified analytic treatment.
Investigating the Zeeman Effect (Lauren Woolsey) 
Magnetic fields are found throughout the galaxy, and one of the few ways to observe them are through Zeeman splitting of spectral lines (other important ways include Faraday Rotation and the polarization of starlight by dust).
The module has been written in Mathematica and is presented is in the Computational Document Format by Wolfram. It provides synthetic observations of the Zeeman effect in neutral hydrogen, OH ions, and water in the Stokes I and Stokes V spectra, based on user inputs describing the cosmic environment of interest. Specifically, for a chosen emission line, the user can change:
A) the temperature
B) the amount of turbulence
C) the magnetic field strength
The signal-to-noise ratio can also be specified to reproduce more accurately the true observations one might make, and the user can “zoom in” on very small signals in Stokes V. Final version has been published through the Wolfram Demonstrations Project.

This is an awesome idea. I’ll give all of them a try in the coming weeks.
[…] interactive simulation of the Lyman alpha forest phenomenon. Yuan-Sen’s work is part of a remarkable set of modules, ranging from exhaustive Worldwide Telescope tours to wonderfully illustrative javascript and […]