These online notes accompany the class discussion of the cold phase of the Interstellar Medium (ISM), discussed in AY201b class on (2/15/2010 , 2/17/2010, and 2/22/2010).
Additional Material:
- Radiative Processes of 21cm Formalism: Lengthy derivations of optical effects of 21cm radiation are attached as a PDF here. The ubiquity of equations demanded a different format than the wordpress post. For definitions of
 , etc, please reference Chapter 7 of Draine.
- Primary reference material is from Bruce Drain’s Physics of the Interstellar and Intergalactic Medium, Princeton University Press, Chapters 29 through 33. Figures are reproduced with permission of the author.
- This post will focus on the cold neutral phase of the interstellar medium. For more on the different phases of the ISM, check out Tanmoy’s post about the 1977 McKee and Ostriker paper.
- Molecular Cloud complexes log-plot sketch. Although the mass of the cloud complex does not exactly correlate with the inverse of number density, I hope this plot will visualize the differences between these different cloud types.
HI Clouds: Observations (Ch 29)
HI regions are primarily observed through the 21-cm (1420 MHz) line transition that results from the spin-flip of a neutral hydrogen atom from the triplet state to the singlet state. This transition was predicted to be visible by Van de Hulst in 1944, and was discovered by Ewen and Purcell in 1951, from the lab window of Harvard’s very own Jefferson Lab. If you’re interested, see the NRAO’s web page for more information about the historic achievement. Believe it or not, the actual horn antenna that made the detection now sits outside the offices at the NRAO Green Bank campus. Other teams of astronomers were very close to detecting the line, and once they learned of Ewen’s novel frequency-switching technique to reduce the noise, they were able to confirm the discovery of the 21-cm emission. For a really interesting discussion on why Ewen and Purcell succeeded, check out K. Stephan’s article in IEEE. Today, there is a quest for the analogous deuterium line at 327 MHz. For more on deuterated species, check out this posting on the arXiv by Bell et al 2011.
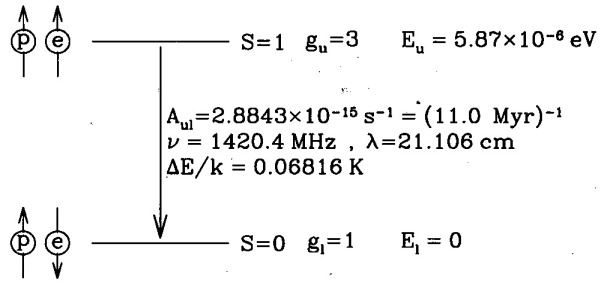
The hyperfine splitting of the 1s ground state of the hydrogen atom, resulting in 21cm radiation. (Fig 8.1 from Draine).
For an introductory quantum mechanical derivation of the 21-cm line (hyperfine splitting), please see section 6.5 of David Griffith’s Introduction to Quantum Mechanics. (See Figure 8.1 in Draine). The rate of spontaneous decay after being excited is on the order of one decay every  years.
Approximately 60% (by mass) of gas in Milky Way is in HI regions, where hydrogen is atomic. This makes up about  , which is about 4.4% of the total visible matter. (The rest of the gas is 23% ionized hydrogen, and 17% molecular clouds) (Draine Table 1.2). HI is not really in clouds like molecular hydrogen (
 ), and has a filling factor of 20% to 90% depending on the situation. The principle results from 21-cm line surveys can be found by Kulkami and Heiles 1998, in Galactic and Extragalactic Radio Astronomy, Verschur and Kellermann.
Consider the following important definitions relevant to HI 21-cm observations and modelling:
- Permitted Transition: These atomic and molecular transitions are what we generally think of when we work with the quantum mechanics of atoms and molecules. They occur relatively quickly and are the dominant transitions at high densities (such as the atmosphere of the earth). For example, H
 and H
and H .
.
- Forbidden Transition: Many of the transitions that are governed by basic quantum mechanical selection rules are most relevant for conditions where there are collisions, or in the absence of external fields and spin-orbit coupling. Forbidden transitions are made possible through magnetic dipole or electric quadrupole transitions from atoms that are collisionally excited. As one might expect in the low density regions of the ISM, these transitions are very common (regardless of being termed “forbidden”). As Tanmoy’s comment explains, forbidden transitions generally take much longer to decay, and thus in higher density regions, the excited state is usually de-excited by a collision rather than emission of radiation.
- Critical Density: The density at which the collisions can keep up with the spontaneous radiative transitions. Defined as
 , where
  means “upper-to-lower,”
  is the Einstein A-coefficient (units 1/s), and
  is the collisional rate coefficient (units
  ). If
). If  , then the line flux is
  , but if the
  then the line flux is
  , the column density.
Recall that the time constant  years, thus for HI in the ISM
  . Which means that in the cold neutral medium (CNM) HI is primarily collisonally excited. However, the energy difference between the two spin states is small enough that the cosmic microwave radiation itself is strong enough to populate the upper spin state. Thus, the upper spin state contains approx 75% of the HI, and therefore HI emissitivity essentially independent of spin temperature. However, in the warm neutral medium (WNM), Ly
 can play a role (K&H and Field 1959).

The distribution of matter in the cold interstellar medium (ISM).
Radial Distribution of HI
Using radial velocity measurements, the spiral arms of our galaxy can be identified by the peaks of the 21cm line, since these are the regions where the intensity is strongest due to the abundance of HI.
Maps of HI in our galaxy: Fig 9 of Nakanishi and Sofue 2003.
The Zeeman effect introduces a frequency shift for left and right circularly polarized radiation. For regions with simple line profiles, this can be used to determine B field (parallel). The interstellar B field is on the order of 10 micro Gauss.
For more detailed information on excitation temperature, line profiles, and more, reference the 21cm radiation supplement and Draine Chapter 8. First year students can also reference their AY150 problem sets #3 and #7.
HI Clouds: Heating and Cooling (pg 337) (Ch 30)
The following processes are responsible for the heating and cooling of HI regions:
- Cosmic ray ionization
- photoionization by x-rays of H, He
- photoionization of dust grains by starlight UV
- photoionization of C, Mg, Si, Fe, etc by starlight UV
- Heating by shocks and magneto-hydrodynamics (MHD)
How cosmic rays interact with HI regions is largely dictated by the ionization state of the HI. A cosmic ray will ionize neutral hydrogen. The primary electron from this ionization can interact with the nearby HI in two ways. If the fractional ionization is high, then the electron has a high probability of scattering with other electrons via long-range Coulomb interactions, converting all of the initial kinetic energy into heat. If the fractional ionization is low, however, then the electron can then create a secondary ionization of another neutral hydrogen atom, or simply excite it’s electron into a higher energy level.
X-rays are an important source of heating only in clouds that are close to strong sources of < 200 eV x-rays. Lower energy x-rays can heat surface of an HI cloud, while higher energy x-rays can penetrate all the way down into the cloud (and possibly through it).
The photoelectric heating of dust is dominated by photons h nu > 8 eV. Photoelectrons (electrons emitted from dust grains via the photoelectric effect) are the dominant heating mechanism in the diffuse neutral ISM.
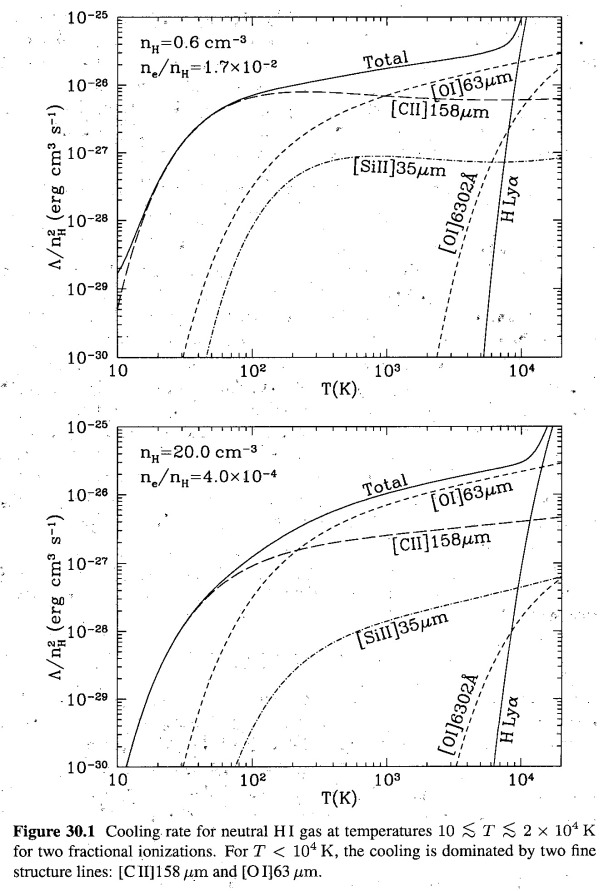
Line cooling is an important process where by atoms are collisionally excited, and then radiatively deexcited, releasing their radiation. Important lines such as [C II] 158 microns and [O I] 63 microns dominate the cooling for T < 10^4 K. (Include Figure 30.1, cooling rate graph). The critical densities for these lines are  /
/ , so collisional de-excitations of these lines in the diffuse ISM are unimportant.
Pressure Balance in HI regions
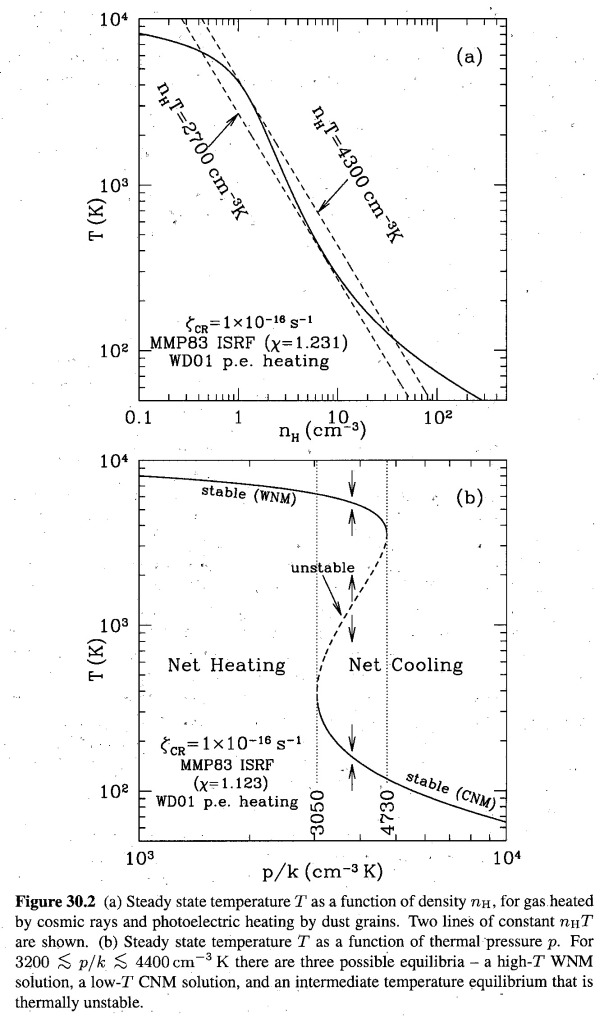
First, fix the pressure and then see where heating and cooling balance. For diffuse material, we have the warm neutral medium (WNM). For more compact material, we have the cold neutral medium (CNM). The central points of these is unstable, and the ISM will separate out into two phases. This theory was first developed by Field (1969), but then photoelectric heating by dust was developed, and reworked (Figure 30.2 for net heating, cooling). Table 30.1 in Draine gives the conditions at stable equilibrium, the state of ionization and the emission spectrum.
Molecular Hydrogen (Ch 31)
For those unfamiliar with astro-jargon, astronomers have many colloquial names to refer to the many different ionization states of hydrogen. So far, we have referred to neutral, atomic hydrogen (one atom) as HI. If this single hydrogen atom is ionized (it lost it’s electron), it is termed HII. However, if we have a diatomic molecule comprised of two hydrogen atoms, we follow the regular chemical convention and call this  . Which means it is a nuisance to be precise when stating in conversation whether you are observing HII or
  .
.
The formation of  is an interesting process. Because
  is a homogeneous diatomic molecule, it has no electric dipole moment, and thus there is no easy way (asymmetry of charge) to remove energy from the system via reactions like
  .
.  in astrophysical situations is formed by radiative association and associative detachment. First, the
  ion is combined with neutral H, and then the extra electron is radiated away in this exothermic ion-molecule reaction. In the absence of dust, this is the dominant channel of formation.
However, dust can be used as a catalyst to expedite the formation of  . Once a hydrogen atom hits a grain, it performs a random walk on surface, and settles down. After some time, another H might impact the (relatively) large surface area of the grain, random walk into the previous one, combine, and release enough energy to get kicked off the grain surface as an
  molecule. Alyssa likened termed this the “singles bar” scenario of
  formation. This can also spin up the dust grain, giving rise to the continuum microwave emission.
The principal destruction process of  is photodissociation
If a molecular cloud of  or other species is of significant size, then it is likely it will be self-shielding. Photoexcitation transitions at the outer surface of the cloud become optically thick and the inside of the cloud is shielded from starlight from outside. These photoexcitations change vibrational and rotational levels by UV pumping. Later, the
  cascades back down via spontaneous emission by quadropole transitions, since there it has no electric dipole moment.

Vibrational levels have lifetimes ~10^6 s (~ a few weeks), and collisional dexcitation is unlikely at these densities. However, in the ground vibrational state, the lowest rotational levels last long enough that they can be collisionally deexcited.
Below is an interesting plot of the rotational excitation of  in diffuse clouds for various column densities. If the self-shielding is low, then the rotation distribution (which rotational states does
  fill?) is insensitive to the gas temperature because it is the result of UV pumping. However, for larger column densities, the effect of self-shielding increases and the fraction of hydrogen in the upper rotational levels (
 ) decreases. For very high column densities, the UV pumping rates are small enough that the rotation temperature is an accurate measure of the gas temperature.

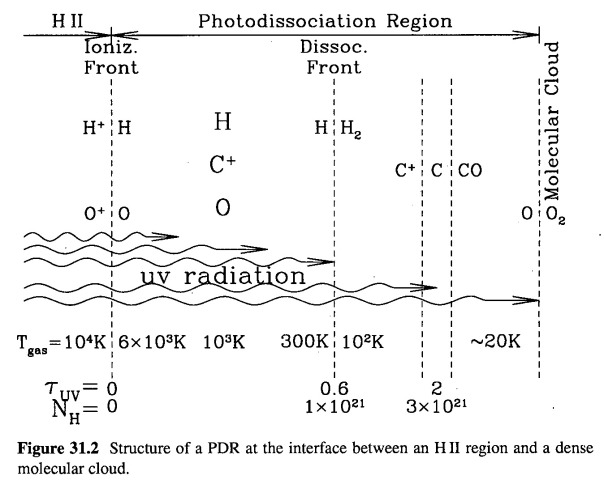
The interface between the HII region and the dense molecular cloud is called a Photodissociation Region (PDR), which bounded by an ionization front and a photodissociation front. We will hear more about this from student #5 on 2/24 and 3/1 (to be linked in the future).
Molecular Clouds: Observations (Ch 32)
Molecular clouds are separated based upon their optical appearance (diffuse, transulcent, or dark), which is really a measure of  , the visual extinction.
Diffuse and transluscent clouds: pressure-confined, self-gravity. Large  . There are even some infrared dark clouds.
There is some ambiguity between “clump” and “core” amongst authors. Giant Molecular cloud and dark clouds are distinguished by mass. Groups of clouds are cloud complexes, and structures within a cloud are called clumps. See Draine Table 32.2 for terminology for cloud complexes and components.
If the clumps are forming stars, then they are called star-forming clumps.
Cores are density spikes that will form a single or binary star. Most of the mass is in Giant Molecular Cores with  .
.
Molecular clouds were originally discovered by star counts; astronomers such as Barnard concluded that the large patches of stars missing in the Milky Way were actually blocked by dust. Nowadays, these clouds are commonly observed through molecular line emission, and then use a conversion factor to get the abundance of  .
.
Although the mass of the cloud complex does not exactly correlate with the inverse of number density, I made a rough log-plot sketch to visualize the differences between these different cloud types.
